
How can I gain more control over the ASP.NET cache?
As we've seen, declarative caching provides a great return on
investment -- it's very easy to enable, and will give you some
immediate performance benefits. However, you can gain even more benefit
from the ASP.NET cache with only a little more work.
Solution
If you'd like to really take advantage of caching in ASP.NET, it's
time you met the Cache API. Declarative caching might be easy to set
up, but it can only take you so far. Unlike declarative caching, which
stores and reuses rendered HTML, the Cache API allows you to store data
efficiently in your application logic or code-behind code.
The simplest way to think of the ASP.NET cache is to compare it to
the Application object. They're similar in that you can use both to
store objects or values by a string key:
Cache["States"] = new string[] {"Alabama","Arkansas","Alaska"};

Cache["ProductData"] = GetProductDataset();
So what's the difference between the Application object and the
cache for the storage of information? ASP.NET can remove items from the
cache whenever it needs to free up memory. The cache has a limited
amount of memory to work with, so when new content is added to the
cache, the cache usually has to delete some older, cached data.
Different classes of information can be stored in your cache:
- Expensive data is information that you want to keep in the cache whenever possible. The term "expensive" refers to the fact that the generation of this class of data involves valuable resources (database or processing power).
- Inexpensive data refers to all of the other types of information that you'd like to put in the cache if there happens to be room, but is not particularly resource-intensive to generate.
The challenge is to prevent the inexpensive data from pushing the expensive data out of the cache.
The
Cache object comes with some features that give you
some control over which items are placed in the cache, and how long
they stay there. Using the Cache object, you can apply
custom cache dependencies, explicitly set cache expiration policies,
and define callback events that fire when an item is removed from the
cache (so you can decide whether you'd like to add it to the cache
again).
One of my favorite features is the sliding expiration, which is a
setting that lets you specify that an item should stay in the cache --
as long as it has been used within a certain period of time:
Cache.Insert("ProductData", GetProducts(), null,

    System.Web.Caching.Cache.NoAbsoluteExpiration,

    TimeSpan.FromMinutes(10));
The above code tells the cache that we'd like it to keep our
Products data set, as long as it has been used in the past ten minutes.
The benefit of this approach is that frequently used data will stay
cached, and infrequently used data will expire and stop taking up
valuable space.
We can customize the settings for our cache, for example, setting a
longer sliding expiration timeframe on data that's more expensive (such
as that which results from a web service call). We could even add a
cache dependency on the results of a
GetLastUpdateTimestamp
web service call to keep the data current if needed. Remember, though,
that any data can still be removed from the cache at any time -- our
sliding expiration time setting is really just a suggestion to the
cache system.
Discussion
Once you've begun to cache your data, you'll begin to see the
benefit of what are some tried and true cache access patterns. Steven
Smith wrote about the cache data reference pattern in his excellent MSDN article. Here's some code that implements this pattern:
public DataTable GetCustomers(bool BypassCache)

{

  string cacheKey = "CustomersDataTable";

  object cacheItem = Cache[cacheKey] as DataTable;

  if((BypassCache) || (cacheItem == null))

  {

    cacheItem = GetCustomersFromDataSource();

    Cache.Insert(cacheKey, cacheItem, null,

        DateTime.Now.AddSeconds(GetCacheSecondsFromConfig(cacheKey),

        TimeSpan.Zero);

  }

  return (DataTable)cacheItem;

}
Smith's article explains the technique in more detail, but the most
important point to note is the possibility that the object may not be
in cache, or could potentially be removed at any time. The above code
is safe because it loads the cached object, checks whether the object
is null, and, if so, loads the object data and adds it back to the
cache.
Another of my favorite cache patterns is one that Gavin Joyce uses on his DotNetKicks site -- the reluctant cache pattern, which relies on his
ReluctantCacheHelper class. This pattern prevents an application from adding to the cache information that's unlikely to be used.
For example, when Google indexes your site, it will load every page
that it can find. If your site implements a cache that is used by a
large number of pages, your server will perform a lot of unnecessary
work adding data to the cache, only for that data to be immediately
dropped from the cache as other pages are added. Similar to the sliding
expiration pattern, but in reverse, this pattern only adds data to the
cache if it's been used a lot recently. Here's an example that
implements this pattern:
public static List GetCustomers() {

  string cacheKey = "Customers";

  int cacheDurationInSeconds = 5; // low number for demo purposes

  object customers = HttpRuntime.Cache[cacheKey] as List;

  if (customers == null) {

    customers = CustomerDao.GetCustomers();

    if (new ReluctantCacheHelper(cacheKey,

        cacheDurationInSeconds, 2).ThresholdHasBeenReached)

    {

      HttpRuntime.Cache.Insert(cacheKey,

          customers,

          null,

          DateTime.Now.AddSeconds(cacheDurationInSeconds),

          System.Web.Caching.Cache.NoSlidingExpiration);

    }

  }

  return (List)customers;

}
How do I speed up my database queries?
We've looked at a few ways to optimize your ASP.NET code, but if
your queries are slow, you'll still have a site that drags its heels.
You can hide the problem to some degree if you cache your data or add
servers to your web farm, but eventually you will need to deal with
your slow queries.
Of course, the best bet is to work with a good Database
Administrator (DBA). We're ASP.NET developers, and while we can't help
but learn about databases as we work with them, database administration
is not our full-time job. A good DBA is by far the best solution to a
database problem, but sometimes, it's just not an option. If you work
on a team without a DBA, or you have limited access to your DBA, you
need to do your best to solve problems when you can.
Slow Query or Slow Database?
It's important to decide whether you're dealing with one slow query
or a whole slow database. Is one particular page slow, or is the whole
site groaning? This solution will focus on the former; if you can
narrow your database performance problems down to individual queries,
refer to the section called "How can I troubleshoot a slow query?"
later in this chapter.
Solution
Use the SQL Profiler and Database Tuning Advisor, located in the SQL Server Performance Tools folder.
Tuning a database server is hard. Initially, it can be difficult to
find out what's responsible for slowing things down. Even then, fixing
one problem (for example, applying indexes to a table to improve the
speed of
SELECT statements) can introduce new problems (such as slower INSERTs and UPDATEs).
Fortunately, the existence of the SQL Performance Tools means you don't have to bother with guesswork.
The SQL Profiler captures what's going on in your database,
including which SQL statements are being executed, who's executing
them, and how long they're taking. The profiler is the first step to
determining what's actually happening on your server.
Note that the profiler captures both ad hoc and dynamic SQL. This
means that the profiler is especially useful when control, library, or
framework code is making a call in your database -- you may not have
access to the ASP.NET code, but the profiler will reveal exactly which
queries are being executed, and how long they are taking.
It's best if you can run a profiler trace on your actual production
system, but this may not always be possible -- profiling a server slows
the server down, and the site's regular users may not appreciate the
extra delays. If you can't run on the production system, you can still
gain a reasonable idea of server activity on a local or development
server by simulating the way real users would using your site on the
live server.
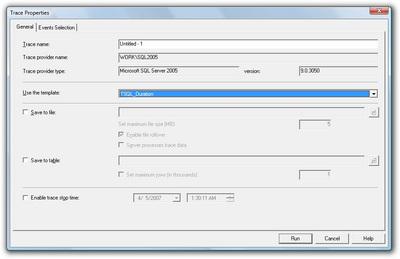
Running the profiler can be a bit daunting the first time -- there
are numerous advanced settings to monitor and tweak. It's best to start
out with a predefined template like the one I've chosen in Figure 15.9.
The two most useful templates for general performance diagnostics are
the TSQL_Duration and Tuning templates.
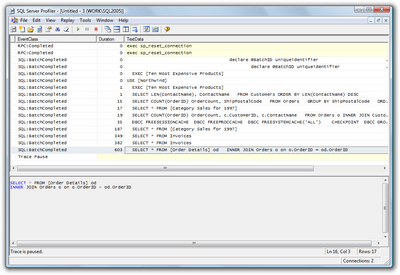
The TSQL_Duration template is useful for giving you a quick snapshot
of the queries and stored procedures that take the longest time to
execute. Figure 15.10 shows some sample queries running against the
Northwind example database. The slowest query -- the query with the
greatest duration value -- is highlighted at the bottom of the list.
In a simple case like the one above, you may be able to deduce
enough information from the TSQL_Duration trace to begin tuning a
specific query. If you're at all in doubt, however, it's best to run
the profiler with the Tuning template and analyze the results in the
Database Tuning Advisor (also referred to as the DTA), a tool for
analyzing database performance and suggesting which tables should be
indexed.
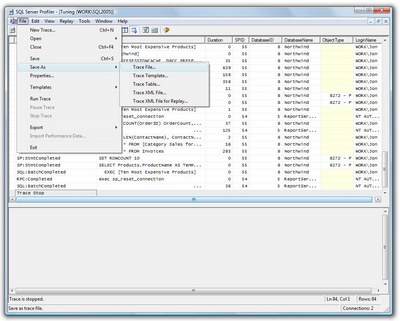
To do this, first save your trace file from the profiler, as shown in Figure 15.11.
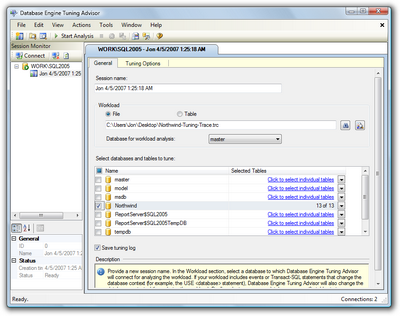
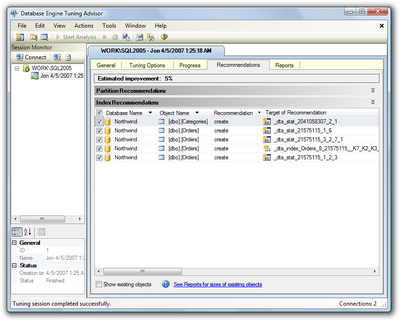
Now, we'll use the DTA to open the trace file that we just saved, as
I've done in Figure 15.12, and click the Start Analysis button.
For my sample queries, DTA recommended that I apply a few indexes,
to produce an estimated performance improvement of 5%, as shown in
Figure 15.13. (The Northwind database is already more or less indexed;
your estimated improvement should be a lot higher, with any luck.)
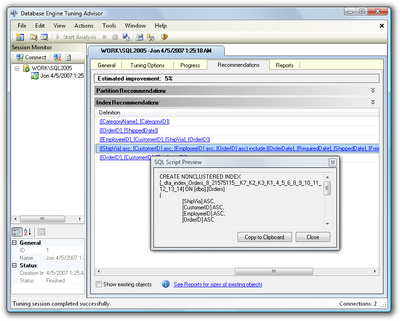
If you scroll to the right, so that the Description column is
visible, you'll see exactly which indexes and statistical changes the
DTA recommends. Click on a recommendation to see a preview of the
script that will add the proposed index, as shown in Figure 15.14.
To implement these changes, I suggest you save the recommendations
(Actions > Save Recommendations...), review them in SQL Server
Management Studio (SSMS), and apply them if you feel comfortable with
them. Once you've done this, repeat your original profiling test and
verify that the changes have improved your database performance.
Running the DTA with a SQL Workload Script File
Our walkthrough of the DTA used a SQL Server Trace file for the
workload, but you can also use the DTA against a SQL script. Here's an
abbreviated copy of the script I used for this walkthrough:
Example 15.10. SampleSqlWorkload.sql (excerpt)


USE [Northwind]

GO

SELECT * FROM [Order Details] od

INNER JOIN Orders o on o.OrderID = od.OrderID

GO

SELECT * FROM [Category Sales for 1997]

GO

SELECT * FROM Invoices

GO

SELECT COUNT(OrderID) OrderCount, ShipPostalCode

    FROM Orders

GROUP BY ShipPostalCode

ORDER BY COUNT(OrderID) DESC

GO

EXEC [Ten Most Expensive Products]

GO

SELECT COUNT(OrderID) OrderCount, c.CustomerID,

    c.ContactName

FROM Orders o INNER JOIN Customers c

    ON o.CustomerID = c.CustomerID

GROUP BY c.CustomerID, c.ContactName

sORDER BY COUNT(OrderID) DESC

GO

SELECT LEN(ContactName), ContactName

FROM Customers ORDER BY LEN(ContactName) DESC

GO
The important point to note is that there are GO separators
between statements, which ensures that they're executed independently.
You'll want your SQL workload script file to simulate actual usage,
which means that you should include repeated calls to the most commonly
used queries.
Using the Performance Dashboard
SQL Server includes Dynamic Management Views (DMVs) -- database
views that contain lots of useful management and troubleshooting
information about your database. All the DMV views begin with the
prefix
sys.dm_; for example: sys.dm_index_usage_stats.
SSMS includes some built-in reports that leverage SQL Server
Reporting Services as well as the DMVs. You can view these reports in
SSMS if you right-click a database and select Reports > Standard
Reports....
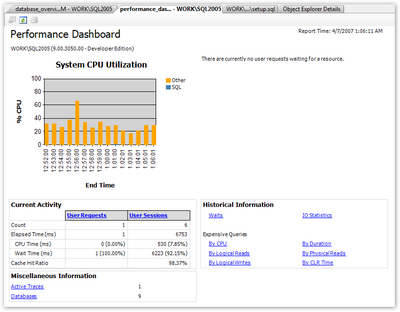
SQL Server SP2 includes the ability to include custom reports, and one of the first to be released is the Performance Dashboard.
Once it's installed, the Performance Dashboard gives you a graphical
snapshot that's visible in your browser, without you having to run a
trace. Figure 15.15 shows the dashboard in action.
Discussion
One important aspect of troubleshooting a slow database is to
understand what's making it run slowly. There are many potential causes
of slow performance, but some common problems head the list. Let's look
at a few of them.


No comments:
Post a Comment