
The ability to index data is one of the key benefits of storing information in a database. Imagine for a moment that you need to look up a name in a telephone book. You take advantage of the fact that the last names are sorted in alphabetic order -- it would take forever to find a name if the entries were listed in random order. Databases take advantage of the way your information is sorted for the same reason. The default sort order in a table is called a clustered index.
Of course, you may want to search for your information in several different ways. To continue with the phone book example, you may want to look up businesses by zip code, business type, or name. The common approach to implementing this capability in a database is to order the data based on the most common search order, then place additional indexes to facilitate other search criteria. The data is sorted by the clustered index, but the database stores additional information to help it look up rows using other criteria. This additional lookup information is called a non-clustered index.
One of the most common reasons for slow queries is that the database is performing a table scan, which occurs when the database lacks an appropriate index to use to look up data. Asking your database to perform a table scan is equivalent to asking someone to look up a person in a phone book that lists entries in random order. To summarize, proper indexes are a necessity for database performance.
Incorrect Indexes
If indexes are good, more indexes are great, right?
Actually, no. There's a cost incurred when you add indexes to a database. Each time a row is added or updated, all the indexes need to be updated, and too many indexes can slow your database down. It's important to select a limited number of indexes that'll give you quick lookups without slowing down your updates. We'll be talking about some tools to help you with this task later in this chapter.
Poorly Written Queries
It's easy to land yourself in trouble if you don't really understand SQL. SQL is not just another programming language -- it's a declarative, set-based query language. A lot of your standard programming tricks don't apply here.
We'll talk about troubleshooting query plans and poorly written queries in the section called "How can I troubleshoot a slow query?" later in this chapter.
Deadlocks
Databases use locks to prevent your data from being messed up by conflicting updates.
For example, we can't apply a 10% discount to all of our product prices and delete all products that are priced over $100 at the same time -- we need to process one product at a time. Locks allow us to do this. The SQL Server engine is reasonably clever about how it uses database locks -- it'll often lock portions of a table (called pages) and, sometimes, individual rows.
Yet there's always the potential for two transactions to arrive at a state where both are waiting for the freeing of a lock that's simultaneously held by the other transaction. This situation is called a deadlock.
For example, consider two queries that use the Products and Orders tables. The first query, which we'll call
ProductsThenOrders, uses the Products table first; the second query, OrdersThenProducts, uses the Orders table first.ProductsThenOrders locks the Products table and begins to make updates. Meanwhile, OrdersThenProducts locks the Orders table and performs its updates. No problems so far.Now
ProductsThenOrders is ready to update the Orders table, but it can't -- the other query has it locked. Likewise, OrdersThenProducts wants to update the Products table, but is also blocked for the same reason. We're deadlocked!When SQL Server eventually detects a deadlock, it will pick one query as the "deadlock victim" and kill it, while the survivors are released. The result of this conflict resolution process is that one of the queries will return with an error that it was unable to complete -- not the most efficient use of resources.
Deadlocks don't happen too frequently -- unless your application executes a lot of transactions. It's important to be aware of them and to fix deadlock conditions quickly. Deadlocks can be avoided by:
- minimizing transaction length
- accessing tables in the same order in competing queries
The NOLOCK Query Optimizer Hint
Even if you're not encountering deadlocks, locks have a definite performance impact. Locks restrict access to your data in such a way that only one query can use it at any time -- an approach that's safe but slow.
In some cases, you mightn't need to lock your rows. You might query historical data that isn't subject to change, or it mightn't be crucial that the data returned in the query is perfectly up to date -- comments on a weblog might fall into this category.
In these cases, you can use the
NOLOCK hint to tell
SQL Server you want to read directly from the table without honoring
any locks. Note that this only makes sense for SELECT
statements -- any data modification will always require a lock. Best
practices avoid using table hints -- parameters that override the
default behavior of a query -- when possible. However, this one is
relatively innocuous as long as you understand that you may be viewing
uncommitted changes. Just don't use it when displaying critical
information, such as financial data.Here's how you'd use it:
SELECT COUNT(1) FROM Orders WITH (NOLOCK)Since this statement places no locks on the data that it's reading, other queries won't be forced to wait for the query to complete before they can use the
Orders table.You can read more about deadlocks in the MSDN article, "Analyzing Deadlocks with SQL Server Profiler."
Hardware Issues
As with any software application, SQL Server performs at its optimum when it's running on sufficiently powerful hardware.
If upgrading your server is an option, the first thing you should look at is memory, as SQL Server makes heavy use of available memory to cache frequently used data. And the cost of new memory is relatively cheap -- often cheaper than the time required to tune an underpowered database server. Adding memory can compensate for slow CPU or drive access, since caching can significantly reduce the work that SQL Server needs to complete.
After you've exhausted your memory upgrade options, the next most common hardware issue is a disk read/write bottleneck. Database hardware configuration is a large topic and falls well beyond the scope of an ASP.NET book, but a great first step is to put your log files on a drive that's as fast possible, and is separate from the operating system and database files.
Using a production database server for other tasks -- especially IIS -- is a bad idea. It's often necessary in a development environment, but it will have a performance impact in production.
How can I troubleshoot a slow query?
Optimizing database performance is a complex topic that's the subject of numerous very thick books, so I'm not going to pretend that we can make you an expert in query optimization in a few short pages. Instead, I'll focus on some of my favorite "developer to developer" tips to point you in the right direction.Solution
Before you begin to look for a solution, it's important to verify the problem at hand. You can then begin the process of elimination.
Verifying the Problem
First, verify that the SQL you think is being executed is actually being executed. The best way to confirm this is to duplicate the problem: run the query in SQL Server Management Studio (SSMS).
If you have any doubt about which SQL commands are being executed, run the SQL Profiler for confirmation (see the section called "How do I speed up my database queries?" earlier in this chapter for details on using the SQL Profiler). This tool is especially helpful when used with applications that make use of declarative data binding, or with frameworks that handle data access for you.
Clearing the SQL Cache when Testing in SSMS
SQL Server uses an intelligent caching system to enhance performance. If you run frequent queries against a certain table, SQL Server will recognize that fact and store the source (and result data) of those queries in its internal cache. By doing so, future matching queries won't need to look up this data until the next time it changes.
This functionality, while useful, can be confusing if you conduct your tests by running your queries from SSMS -- some of your query information may be cached, so your queries will run faster the second time you execute them.
To ensure that you make valid comparisons that don't return cached information, clear your cache each time you run the query. The following script does just this -- first it drops caches, then it calls a
CHECKPOINT to flush pending changes from memory to disk, and finally it clears any data that has been stored in memory:
DBCC FREESESSIONCACHE

DBCC FREEPROCCACHE

DBCC FREESYSTEMCACHE('ALL')

CHECKPOINT

DBCC DROPCLEANBUFFERS

GO -- Your query goes here
Once you're able to duplicate the problem in SSMS, you can dig into the query itself.Checking for Large Result Sets
If your query returns more rows than you expected it to, there are two main problems to look at -- cross joins and incomplete
WHERE clauses.A cross join occurs when you fail to specify a join correctly. Here's an example:
SELECT * FROM Customers, Orders, [Order Details], ProductsIn the above query, we haven't specified how the tables should be joined, so the SQL interpreter will attempt to return every possible combination. That means that our result set will include every Order combined with every Customer (not just the Orders that each Customer made). So this query returns about 12.5 billion rows (91 Customers × 830 Orders × 2155 Order Details × 77 Products) -- that's roughly 7.5GB of data.
That return is obviously way out of line, considering there are only 830 orders in the system. Of course, this is a slightly exaggerated example for demonstration purposes, but it's easy to see how a single cross join can waste a lot of database resources (CPU and memory) and delay network traffic between the database and web server.
An incomplete
WHERE clause isn't quite as bad, but can still return more rows than you need. The following query returns 2155 rows:
SELECT * FROM [Order Details]
This one, on the other hand, returns three rows:
SELECT * FROM [Order Details] WHERE OrderID = 10252
ADO.NET makes it really easy to filter your data on the server, but
unfortunately this feature is a double-edged sword -- it can mask
problems with a large result set. That's why it's important to verify
the problem with real, systematic measurement rather than just assume
that a Gridview displaying only a handful of rows couldn't possibly be the source of the problem.Checking the Query Plan
If your query is indeed returning the correct number of rows, but still takes too long, the next step is to look at the query plan, which is a visual representation of the steps that your query takes to return its result set.
You can view the estimated query execution plan in SSMS if you first select the query, then select Display Estimated Execution Plan from the Query menu (tor use the toolbar button or the keyboard shortcut -- Ctrl-L). You'll also have the option to include the actual query execution plan (also available from the Query menu, the toolbar, and via the keyboard shortcut Ctrl-M). The actual plan is a little more accurate than the estimated one, but requires that you actually execute the query and wait for it to complete.
Let's look at the actual execution plan for the
uspGetBillOfMaterials
stored procedure in the AdventureWorks sample database that comes with
SQL Server. Enter the following text in the SSMS query window, then
turn on the Include Actual Execution Plan option and execute the query:EXEC dbo.uspGetBillOfMaterials 800, '2001-01-09'Figure 15.16 shows the result.
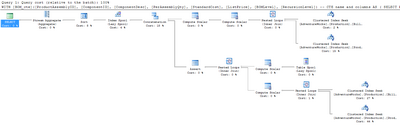
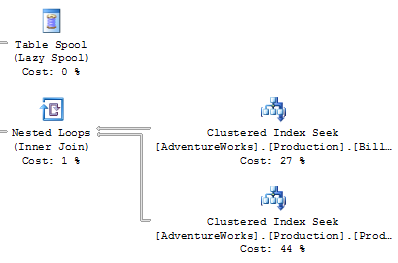
Figure 15.17 shows a close-up of the bottom right-hand corner of our plan.
You'll need to look for a few important things when you're analyzing an execution plan:
- Thick lines in the execution plan indicate large amounts of data being passed between steps. I was once troubleshooting an extremely slow summary report query that returned only a dozen rows. When I looked at the execution plan, I saw that some of the lines between steps were an inch thick -- this indicated billions of rows being passed between those steps, which were then filtered down to the final dozen rows displayed in the browser. The solution was to modify the query to ensure that the data was filtered as early as possible.
- Large percentage numbers indicate the most expensive operations -- the value of 44% in Figure 15.17 is one example of this.
- If one of the steps on your plan contains the word "scan" (or, in particular, "Table Scan"), this is an indication that the SQL engine had to step through every row in a table to find the data that it was after. This is usually associated with a high Cost value. There are occasions when a table scan is acceptable -- such as when you're performing a lookup against a very small table -- but in general they're best avoided.
If it looks as though your issue may be the result of an indexing problem, the best solution is to right-click the query and select Analyze Query in Database Engine Tuning Advisor. The DTA will launch with all the necessary options preselected, so all you need to do is click the Start Analysis button. Figure 15.18 shows the results of one such analysis.
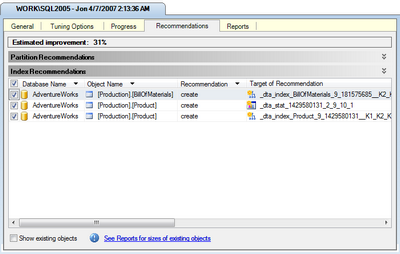
As you can see, the DTA has recommended two index changes and one statistical change that should improve this query's performance by 31%. Of course, you'll need to consider the effect that these additional indexes will have on updates to the affected tables. In this case, since the tables in this particular example are probably updated rather infrequently, I think that these new indexes make sense. You can apply or save these changes via the Actions menu.
Eliminating Cursors
You'll want to look for and eliminate any unnecessary cursors -- pointers for traversing records in the database.
Cursors let you write in a procedural style, applying logic to a single table row at a time. While it can be tempting to drop back to those skills that are most familiar to you in sticky situations, cursor-based queries will prevent the database engine from taking advantage of the index optimizations and set-based operations for which it was designed.
Resist the urge and get rid of your cursors!
I've written a lot of SQL in ten years of professional programming, and I've yet to encounter a case where cursors were required. I recently rewrote someone else's complex query from using cursors to standard SQL, and the time for the resulting operation dropped from eight hours to just over one minute.
Think about how to describe the problem as a bulk operation. For example, suppose your mode of thinking about a query was something like this:
"I'll loop through the orders table, get the product ID, then grab the price, and compare it to ..."
Instead, consider rephrasing it to something like this:
"I want to find all orders for products that have prices greater than a certain amount ..."
Remember that you can use common table expressions (CTEs), table variables, and temporary tables if you're stuck. While these fallback options aren't as efficient as performing a bulk operation, they at least allow the query engine to make use of indexes.
The Problem with
SELECT *Most developers will tell you that
SELECT * queries are bad, but for the wrong reason.The commonly understood reason is that
SELECT * is
wasteful because it returns columns that you don't need. While this is
true, most normalized tables don't contain that many columns, so these
extra rows usually won't have a noticeable impact on your site's
performance unless they number in the millions.Often, the bigger problem with
SELECT * is the effect
it will have on the execution plan. While SQL Server primarily uses
indexes to look up your data, if the index happens to contain all of
the columns you request, it won't even need to look in the table. This
concept is known as index coverage.Compare the following two queries (against the sample AdventureWorks database):
SELECT * FROM Production.TransactionHistoryArchive

  WHERE ReferenceOrderID < 100

SELECT ReferenceOrderLineID FROM

    Production.TransactionHistoryArchive

  WHERE ReferenceOrderID < 100
In both cases, we're returning the same number of rows, and the
SELECT * query only returns 15KB more data than the second query.
However, take a look at the execution plans shown in Figure 15.19.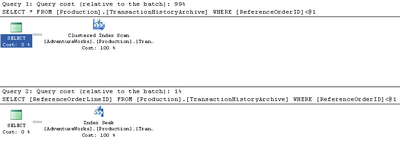
You'll notice that the first query took 99% of the relative work for both queries. The second query was able to look up the values in the index via an index seek -- a search that touches on only those rows that qualify. The first query, however, had to scan all the rows in the table. In this case, the fact that the requested columns were all contained in the search index resulted in a performance difference of nearly one hundred-fold.
It's important to include commonly queried data in your indexes -- something that's simply not feasible if you're using
SELECT *. If you just query the rows you need, the DTA will be able to recommend indexes to cover them.Accessing More Information
There's a plethora of resources to which you can turn when you're stuck on a really difficult SQL database issue. Here are just a few of them:
- The Microsoft TechNet article on troubleshooting performance problems in SQL Server 2005
- SQLTeam.com -- one of many SQL Server community forums
- The SitePoint Databases Forum
Summary
Performance optimization is an iterative process -- be prepared to follow the repetitive steps of analyzing your site's performance, tuning your application, analyzing the performance again, then tuning some more, until your site performs the way you want it to. Premature optimization -- tuning without understanding what's causing the slowdown -- is likely to cause more problems than it solves.ASP.NET and SQL Server 2005 power some of the most popular and powerful sites upon the planet, including MySpace, which serves billions of page views per day. You've got all the tools you need to get the maximum possible use out of your web server -- I hope the tips in this chapter will help you to put them to work.
That's it for this chpater of The ASP.NET 2.0 Anthology, 101 Essential Tips, Tricks & Hacks. Feel free to download this chapter -- along with three others -- for offline reference.


No comments:
Post a Comment