
Now that you've added the finishing touches to your web site
and unleashed it onto the world, fame, fortune, and success will surely
follow -- won't it?
Unfortunately, your web application's success can lead to something
less desirable -- performance and scaling problems. On a traditional
desktop application, one thousand users translate to one thousand
client computers chugging away, sharing the load of running your
application. The application is effectively spread among all the users'
machines. When it comes to a web application, though, those same
thousand users are usually serviced by a single machine -- your web
server.
Success can come at a cost for web applications: a cost in bandwidth
and server hardware. However, there are a few clever ways you can
reduce -- and sometimes eliminate -- these problems. We'll take a look
at some of the different approaches to improving the performance of an
ASP.NET site in this chapter, which has been extracted from The ASP.NET 2.0 Anthology, 101 Essential Tips, Tricks & Hacks. Feel free to download this chapter -- along with three others -- for offline reference.
How do I determine what to optimize?
You want your web application to be the best, right? Like all of us,
by "best" you mean "fastest." And what better way to create a blazingly
fast application than to optimize everything? Optimize, optimize,
optimize -- right? Wrong.
Premature optimization refers to the fixing of a performance problem
before you understand the problem, or before there even is a problem,
and it's a bad idea.
That's not to say that you should write sloppy, inefficient code. My
point is that you should trust the ASP.NET Framework, and make use of
the features that make it such a terrific environment in which to
develop, until you hit a problem. Once you hit a problem, you should
take the time to understand what that problem is, and only then should
you start to look at how best to address it. Dr. Joseph M. Newcomer's essay, "Optimization: Your Worst Enemy," gives a fascinating overview of the perils of optimizing in the dark.
The tips in this chapter propose fairly lightweight solutions for
some common performance issues. I've steered away from dramatic
changes, because I don't want you to end up doubling your development
or maintenance time in order to shave a meagre 2% off your page load
time. While it is possible to bypass the in-built ASP.NET Page
mechanism completely (by using Response.Write, or building an
ASHX-based sites), I'm not a fan of these approaches. The ASP.NET
system as a whole has been tuned and improved for more than half a
decade, and it's reasonably fast straight out of the box. There's a
good chance that trying to improve on it will result in a slower and
less maintainable web site.
So, with all that out of the way, let's assume that some of your pages are running slowly. How do you figure out what to fix?
Solution
Isolate the bottleneck in your site by measuring the actual speed of
the site. This exercise can be performed using logs, database
profiling, and tracing.
We've discussed the task of logging using log4net in Chapter 13,
Handling Errors. If you suspect that the database is the cause of the
slowdown (for example, you know that your application makes use of some
large queries), you can either step through the page in debug mode to
see whether the database calls are taking a long time to return, or you
can use the SQL Server Profiler discussed in the section called "How do
I speed up my database queries?" later in this chapter. For a very
basic analysis of what's going on in your pages, you can use the
ASP.NET trace; while it's not nearly as good as a full-featured logging
system, it's easy to implement and will provide you with plenty of
timing information.
The first step in using the trace is to get into the habit of adding
trace statements. Write to the trace whenever you think there's
something you might want to see when you debug future problems. Tracing
doesn't have any real performance impact on your site until it's
enabled in the
Web.config, and when you need to troubleshoot a problem, you'll be glad it's there.
There's more information on tracing in Chapter 13, Handling Errors,
but the general idea is that you can write to the Trace object like
this:
Trace.Write("Here's a trace message.");
Tracing is disabled by default; when you want your
Trace.Write statements to actually do something, you'll need to turn tracing on in the Web.config file, as follows:Example 15.1. Web.config (excerpt) <?xml version="1.0"?> <configuration> <system.web> <trace enabled="true" mostRecent="true" localOnly="true"/> </system.web> </configuration>
In this solution, we'll look at a sample page that performs a few
different actions -- it makes a call to a web service, retrieves some
data from a database, and throws an exception. Each function that we'll
use writes a trace message when it begins and ends, via a
straightforward utility method called
writeTrace.
However, it has one slightly complex aspect -- it uses the
System.Diagnostics object to figure out the method name, so we don't
have to pass it in. The code for our sample page is as follows:Example 15.2. Trace.aspx.cs (excerpt)
using System;
using System.Web;
public partial class _Default : System.Web.UI.Page
{
protected void Page_Load(object sender, EventArgs e)
{
hitAWebservice();
getSomeData();
doSomeProcessing();
breakSomething();
displayTheResults();
}
private void getSomeData()
{
writeTrace(true);
simulateWaiting(8000);
writeTrace(false);
}
private void hitAWebservice()
{
writeTrace(true);
Trace.Write("A message to demonstrate tracing.");
simulateWaiting(2000);
writeTrace(false);
}
private void doSomeProcessing()
{
writeTrace(true);
simulateWaiting(1000);
writeTrace(false);
}
private void displayTheResults()
{
writeTrace(true);
simulateWaiting(500);
writeTrace(false);
}
private void breakSomething()
{
writeTrace(true);
try
{
int superBig = int.MaxValue;
superBig += 1;
}
catch (Exception ex)
{
Trace.Warn("Exception", "Oops", ex);
}
}
private void writeTrace(bool enteringFunction)
{
if (!Trace.IsEnabled)
return;
string callingFunctionName = "Undetermined method";
string action = enteringFunction ? "Entering" : "Exiting";
try
{
//Determine the name of the calling function.
System.Diagnostics.StackTrace stackTrace =
new System.Diagnostics.StackTrace();
callingFunctionName =
stackTrace.GetFrame(1).GetMethod().Name;
}
catch { }
Trace.Write(action, callingFunctionName);
}
/// <summary>
/// Wait a bit.
/// </summary>
/// <param name="waitTime">Time in milliseconds to wait.</param>
private void simulateWaiting(int waitTime)
{
System.Threading.Thread.Sleep(waitTime);
}
}
Right, we've got our trace statements in place. Now, let's assume
that this page is taking abnormally long to load, and we'd like to get
to the bottom of the problem. With tracing enabled, we can simply load
the page, then browse to
Trace.axd within our web site; it's at http://localhost:1209/MySite/Trace.axd.
Figure 15.1 shows the first part of the Trace.axd output that was returned from the previous code.
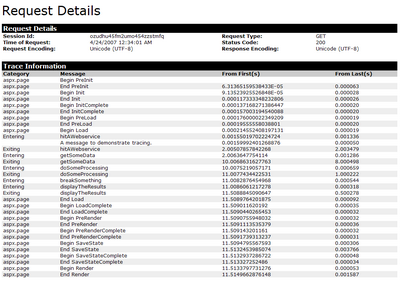
Table 15.1 shows the relevant portion of the trace output.
Right away, we can see which aspect of our page load is taking the majority of time --
getSomeData
takes eight seconds to execute. Without this information, we might have
assumed the web service call was at fault and spent valuable time
solving the wrong problem. This example shows how, armed with some real
information, we can begin to fix the right problem.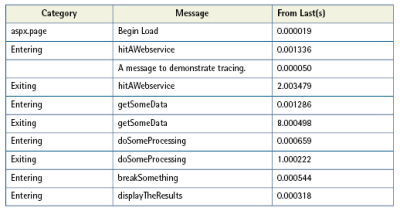


No comments:
Post a Comment